Showing posts with label James Fallows. Show all posts

Monday

Washington Monthly's Annual College Rankings

Update, September 30: Here's a link to Joe Nocera's column published yesterday about the pernicious effects of the college ranking system.

There's a lot to be said about the pernicious impact of college ranking systems in the US; you can read the most cogent criticism here. For a shorter version, read James Fallows' blog post today about the Washington Monthly's annual rankings, released today. You can see the Washington Monthly's rankings here. Read the editors' explanation of their system. Here's a brief excerpt:
The Washington Monthly rankings are based on three factors. The first is social mobility, which gives colleges credit for enrolling many low-income students and helping them earn degrees. The second recognizes research production, particularly at schools whose undergraduates go on to earn PhDs. Third, we value a commitment to service. The more expensive college becomes, the more students are encouraged to see higher education as a mere return on investment. The students in our best colleges are taught by example and design to look beyond themselves and give back.

Friday

Story Maps and more from ESRI

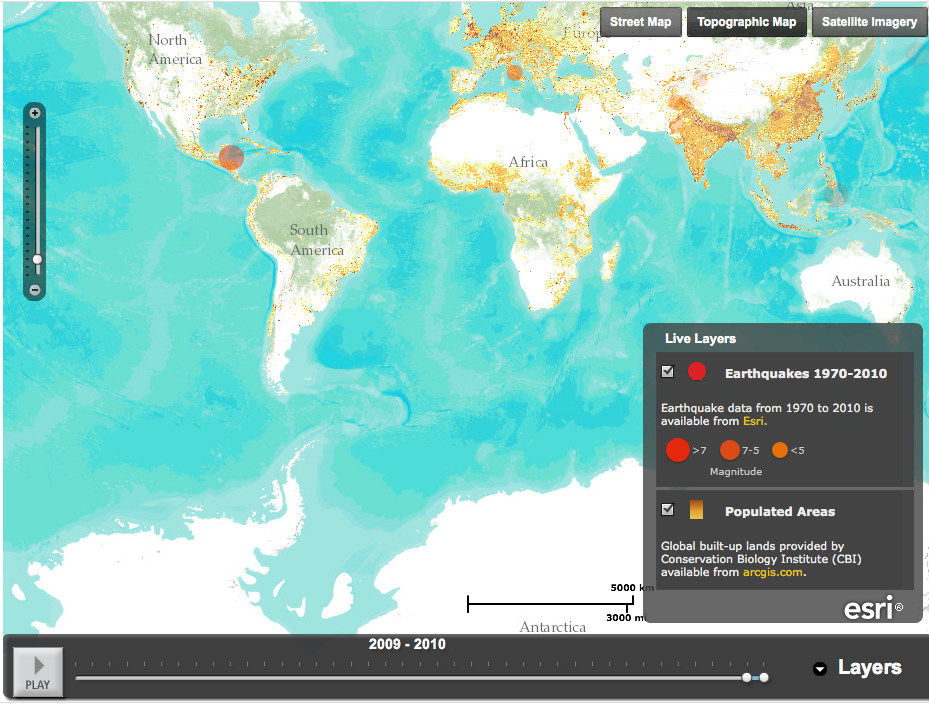
ESRI is a California-based company that encourages companies and not-for-profits to use geographic information software - mapping - to analyze, interpret and understand data. The company also provides extensive maps showing earthquakes, eruptions, and weather events, as part of its disaster response program. Here's a screenshot, for example, of its earthquake timeline map, showing 2009-2010. Note the background of populated areas; by layering the earthquake data on top the map tells you a lot of information quickly.
(Since this is a screenshot it won't play; click here for the ESRI map.)

Telling a story with maps is something ESRI actively encourages - and teaches people how to do on its web site. Here, for example, is an app that lets users follow the Olympic torch relay through the UK. You choose a day, you choose a town and you get a map and a flicker stream of pictures of the torch relay from that day. The site also has an explanation of story maps, templates, and (in pdf) a step-by-step guide to developing a story map.

It's a very clear, well thought through website - I learned about it from James Fallows' blog, where he posted an ESRI map overlaying the storm strength in DC and Maryland this week on top of "social vulnerability" detail, ie, data showing where elderly or low-income people might be. These (there is a regional map, along with detailed maps of Baltimore and Washington) are the featured maps on the ESRI site.

Tuesday

Stabilizing fossil fuel emissions

Here is a great graphic from Climate Central reaffirming the "wedges" analysis for slowing climate change - and demonstrating how much more needs to be done than when the first analysis appeared in 2004.
 

The graph illustrates the concept of the "stabilization triangle," which two Princeton professors, Robert Socolow and Steve Pacala developed to illustrate the efforts that would need to be made to limit the rate of emissions of greenhouse gases. You can read the Socolow's blog explaining it here, and James Fallows' clear gloss here. (I follow Fallows' blog and that's how I found the graphic - thank you.) I recommend reading both pieces for more details, but the short point is vividly illustrated in the graphic. In 2004, there were seven distinct wedges - things that would have to be done - in the stabilization triangle. Now there are 9. And the data are from 2008 (2001 in the first iteration) so they understate the problem.

In his blog post, Socolow argues that advocates are partly at fault for urging prompt action without acknowledging psychological barriers to receiving unwelcome news (I've written about that cognitive bias before), how much about climate science is still unknown, and how risky possible solutions can be. He then goes on to argue persuasively for something he calls "iterative risk management:" looking at a 50 year horizon with 10-year or shorter increments for reduced emissions goals, and taking advantage of increased knowledge (and, one hopes, positive feedback from actions) when setting new targets. It's very clear and well worth taking the time to read.

Popular Posts