Showing posts with label ESRI. Show all posts

Friday

Tracking Sandy


If you're interested, that's a screen shot of the predicted path as of this morning of Hurricane Sandy. For various reasons meteorologists are getting better and better at predicting the paths of storms, though not the intensity at any one time. The possibility that Sandy may come into contact with a more typical North American weather system means that a big hybrid system may develop.
And, as Adam Sobel explains on Climate Central, that would result in an unpredictable storm.
As Sandy moves northward, it will move over cooler water. If this were all that were happening, Sandy would weaken, as tropical cyclones moving toward a pole typically do. At the same time, though, Sandy will come close enough to the upper trough now over the U.S. to interact with that trough in something like the way that an extratropical surface low normally would  . . .
When this happens, they will form a hybrid storm system with some tropical and some extratropical properties. Some energy will still come from the ocean surface, but some will now come from the pole-to-equator temperature contrast. This new energy source will enable Sandy to maintain its intensity, or maybe even increase it.
This process is called “extratropical transition.” It poses a lot of problems for forecasters. In the first place, the computer models aren’t that great at predicting exactly when it will happen. 
So keep an eye on the storm. You can do it easily through ESRI's social storm tracker:

Story Maps and more from ESRI

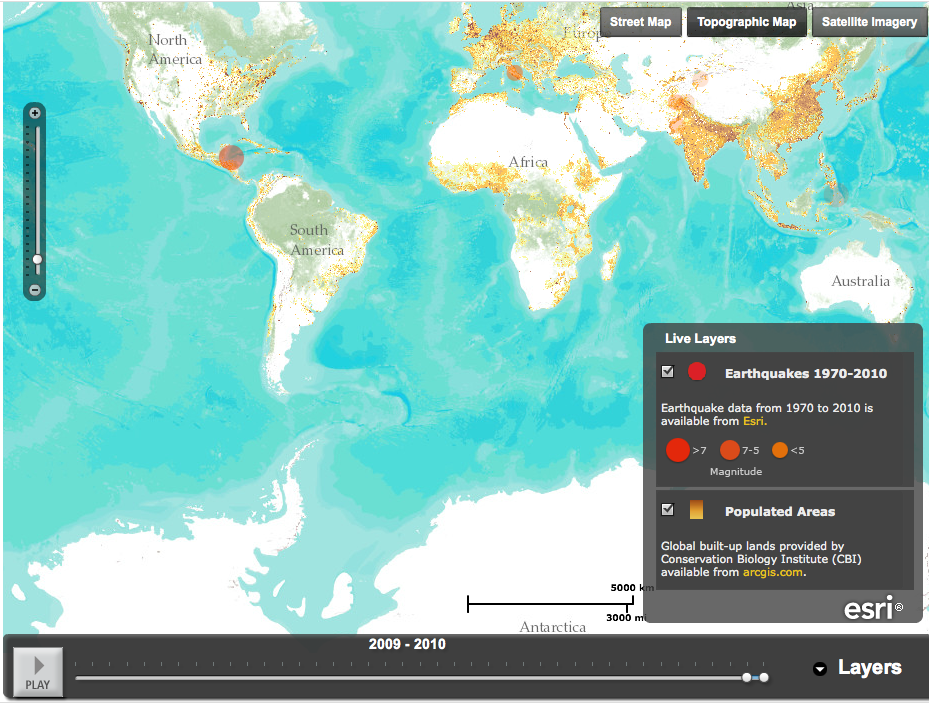
ESRI is a California-based company that encourages companies and not-for-profits to use geographic information software - mapping - to analyze, interpret and understand data. The company also provides extensive maps showing earthquakes, eruptions, and weather events, as part of its disaster response program. Here's a screenshot, for example, of its earthquake timeline map, showing 2009-2010. Note the background of populated areas; by layering the earthquake data on top the map tells you a lot of information quickly.
(Since this is a screenshot it won't play; click here for the ESRI map.)

Telling a story with maps is something ESRI actively encourages - and teaches people how to do on its web site. Here, for example, is an app that lets users follow the Olympic torch relay through the UK. You choose a day, you choose a town and you get a map and a flicker stream of pictures of the torch relay from that day. The site also has an explanation of story maps, templates, and (in pdf) a step-by-step guide to developing a story map.

It's a very clear, well thought through website - I learned about it from James Fallows' blog, where he posted an ESRI map overlaying the storm strength in DC and Maryland this week on top of "social vulnerability" detail, ie, data showing where elderly or low-income people might be. These (there is a regional map, along with detailed maps of Baltimore and Washington) are the featured maps on the ESRI site.

Popular Posts