Showing posts with label The Atlantic. Show all posts

Wednesday

Yosemite fire in images

That spectacular but frightening photograph is of the Yosemite fire, one of several that TheAtlantic.com published yesterday, available here.

And from Grist.org, here is what they call a list of 9 scary facts about that fire. If you have time, watch the video they've embedded - taken from a plane dumping retardant at the edge of the fire, it's got some amazing views.

Amazon deforestation - as seen from space


There's a series of GIFs from Google Earth's Landsat satellite images available - that's the deforestation of the Brazilian Amazon, above. The picture quality isn't great, but the degree of change is pretty clear. You can also see a series showing urban growth around the world here.

Monday

One simple - too simple? - graph to explain US economy's performance

The graph comes from Thomson Datastream via Derek Thompson of TheAtlantic.com - and it shows that the US economy's performance over the last five years was better than that of comparable developed countries: a shallower recession with a faster recovery. Thompson attributes this performance to the facts that:
(a) control our own currency and (b) used aggressive monetary policy to save the banks and lower interest rates while running high deficits.
Do you agree? What's your interpretation of the graph?

How representative is Facebook?

If your friends are like mine, your Facebook feed last week turned red, as people changed their profile pictures to some version of the Human Rights Campaign's equality sticker. (For a slideshow of the variety, click here.) It seemed as if everyone had changed their profile picture. But did they?

On Friday, Facebook reported an analysis by Eytan Bakshy of the changes. There was an uptick of profile photo changes last Tuesday, March 26, "around the time when HRC began urging their Facebook followers to change their profile pictures at 1 pm EST." The uptick was pretty large, with 2.7 million (120 percent) more profile photo changers than usual. Here's Facebook's graph:
Notice that there are no scales on the Y axis, and only the bottom graph has scales on the X axis. Both graphs display time series model; in the bottom, Facebook's number crunchers have smoothed out the data, presumably by lengthening the scale. But, without scales on both axes, we can't know for sure. (Without a scale, we also can't tell where the growth begins - remember, you need to know where the beginning point - 0 - is.) So what, exactly, is this graph telling us? That there was an uptick at some time between March 25 and March 27.

Did all 2.7 million users change their profile photos to some variation of the HRC meme? We have no way of knowing that. I would guess that some did, and others changed their profile pictures to something different. Also, how many people wanted to change their profile pictures but didn't want to take the time to figure out how do it? That's relevant to the next point Facebook's data team makes: that users closest in age
to 30 years showed the greatest increase in updating. This suggests that, on average, 3.5% of 30-year-old Facebook users updated their profiles in response to the events surrounding the HRC campaign. We also found a small, but significant difference expression between genders. On average, 2.3% more self-reported female users updated their profile photo, compared to 2.1% more self-reported males.
Isn't age also self-reported on Facebook, as one of the commenters on Bakshy's post points out? And while we're about it, how many of the profile changers were people as opposed to other organizations? Maybe Facebook has this information. If so, I'd like to see it included in its post.

Oh, and one more point: Facebook has more than 163,000,000 users in the United States, according to socialbakers.com. So that 2.7 million figure is less than 2% of all Facebook users.

I found this column because of a blog post by Rebecca Rosen of TheAtlantic.com titled "Facebook: 2.7 Million People Showed Their Support for Marriage Equality by Changing Their Profile Pictures." Remember, when you're reading these things: it's important to think critically about the statistics and graphs in front of you.


Thursday

More charts illustrating high American health costs


Here's a link to another useful set of charts about the high costs of the American health care system. (You can see a previous post on this topic here.) This one shows prices in the US for various drugs, diagnostic tests, and procedures - like an appendectomy, illustrated in the screenshot  - compared with other countries. Guess what? Every single one of them is highest in the US, by a lot. This Atlantic.com column by Derek Thompson offers the beginnings of an explanation:
Why is American health care so expensive? Books could be written about this topic. And books have been written about this topic. In The Healing of America, T. D. Reid explored why American medicine falls behind other countries in quality while it races far ahead in cost of care.
Near the end of the book, Reid expands on two big reasons why U.S. health care is so expensive: (1) Unlike other countries, the U.S. government doesn't manage prices; and (2) the complications created by our for-profit system adds tremendous costs.

Wednesday

Soda consumption in one graph


Now that New York City's regulations on the sale of large sodas are close to coming into effect, here's a graph showing an interesting convergence: coffee sales and soda sales are coming close, it lease in terms of revenue. (Note that it doesn't show anything about amounts consumed.) It's from Derek Thompson of The Atlantic. He goes on to point out that part of the explanation is that coffee costs more, but another is that we really are starting to substitute water or sports drinks for soda. Read the column - it's a good one. And let me know if you find consumption data anywhere.

Tuesday

Walking more - and measuring it

Here's a new, smaller entry in my self-quantifiers series. Alexis Madrigal, in The Atlantic, has posted a column about his new fitness program: walking. Yes, walking, that famous 10,000 steps per day to fitness, or at least health. According to Madrigal, that's about double the American number of just over 5000 steps per day.

So, how much do you have to walk every day to get up to those 10,000 steps? Ten thousand steps is about five miles (the distance varies with your height and the length of your stride). You don't have to set out to walk five miles to get that number of steps in. But you do have to make an effort to walk places that you might otherwise drive to. In New York City, that's not a problem, but in other places, where there are no sidewalks, it can be.

Madrigal puts it like this:
Americans lag behind the rest of the world in steps taken precisely because we travel so rarely for transportation's sake. Our cities are spread out (NYC excepted) and car culture is everywhere. A Centers for Disease Control study found that almost 40 percent of Americans had not walked for 10 straight minutes in the past week!

Even more interestingly, Gregg Furie of Yale Medical School led a study that showed that less than 25 percent or people walked or biked as a means to get from one place to another for more than 10 straight minutes in a given week. And yet, Furie's study found that people who engaged in "active transportation," as he calls it, had lower BMI, smaller waists, and lower odds of hypertension and diabetes.
I'll give him the last word: "when you have the opportunity to walk as a means to an end, take it."
 

Wednesday

Our genetic quirks

Two stories came out last week about two curious features in our body chemistry. On Wednesday,  the journal Nature explained the age old mystery: why do our fingers and toes wrinkle during a bath? So we can pick things up, of course!
Laboratory tests confirmed a theory that wrinkly fingers improve our grip on wet or submerged objects, working to channel away the water like the rain treads in car tyres.

On Thursday, the Atlantic.com ran this story about the iron we need - and that can poison us. Some of us carry a hereditary condition called hemochromatosis:
a genetic disease leading to a toxic accumulation of iron in his organs. A modern manifestation of an ancient DNA mutation, this disorder can be traced to a single unknown ancestor who lived millennia ago. This mutation allowed her (or him) to more readily absorb iron from food, which may have unexpectedly aided survival in lean times -- possibly at the expense of iron-overload in later generations. . . . [The mutation is found in] nearly one in ten individuals of northern European ancestry.
There are lots of mysteries: why did the mutation arise? Do you need two copies to develop the disease, or just one? Where did it arise and how did it spread? Why is is so common in people of Northern European descent? It's a great story - evolutionary medicine with a modern example.

Monday

In case you missed it Friday - Google trends shows the gun control conversation is continuing

Google Trends is showing a continuing uptick in searches using terms related to gun control or gun regulation. The letters on the graph indicate newspaper articles about various aspects. There's a good analysis of the data by Rebecca Rosen of the Atlantic here.

I will be traveling over the next several weeks and expect to return to this issue in some detail in February.

Friday

Photos of dust storms in Australia

That cloud? It's dust, about to roll over Western Australia. You can see more pictures, via The Atlantic Wire, here. And at Grist.com, here. Tough week to be in Australia.

Tuesday

Amazing photos from National Geographic's photo contest


(one example in the screenshot) are available here (via The Atlantic). There are some amazing photos there, so click through!

Thursday

Obesity studies

You may have read yesterday about a study published in the Journal of the American Medical Association concluding that, although obesity overall was associated with higher mortality rates, overweight (identified by Body Mass Index, or BMI) was associated with statistically significant lower mortality rates. This conclusion has been trumpeted as vindication for the view that we are, perhaps, overfocused on the importance of weight loss for good health. See, for example, here, here, and here.

This conclusion depends, of course, on BMI being a good proxy for mortality risk. There's some evidence that it's not. One drawback, according to Well-Being Wire, is that BMI fails to account for an individual's exercise habits - you can be fit but fit with a high BMI, and slender but sedentary with a low BMI. In those cases, BMI won't tell you who is healthier.

In any case, the study is not an endorsement of heaviness or weight gain. The authors conclude: 
Relative to normal weight, obesity (all grades) and grades 2 and 3 obesity were both associated with significantly higher all-cause mortality. Grade 1 obesity was not associated with higher mortality, suggesting that the excess mortality in obesity may predominantly be due to elevated mortality at higher BMI levels.
And even the next sentence, "Overweight was associated with significantly lower all-cause mortality," needs to be read with some skepticism. As Lindsay Abrams writes at TheAtlantic's web site:
the study fails to take into account any of the various other measures used to assess health. It ignores blood pressure, blood sugar, and cholesterol -- high levels of all are directly associated with a variety of chronic conditions and diseases -- not to mention mental health and life satisfaction scores.  
She provides some interesting pictures that make the point about BMI, and concludes:
While in the most basic of ways, it makes sense to pay attention to the number on the scale, it only gives us one metric of health that, if not understood in context, is basically useless. If we could get used to looking at weight more holistically, in terms of overall health, the link between BMI and longevity wouldn't be so shocking.
So read the study. Think about it. And then continue to work out.

Tuesday

Four Charts and a Video

in which The Atlantic identifies the impact climate change is having already.

Bonus picture:
That's a time-lapse picture of glacial ice melting in the Arctic, illustrating the Guardian's article about a new film, "Chasing Ice." More pictures available at the links.

Image via guardian.co.uk

Thursday

Political action on climate change . . . . maybe?

So we've just had a monster storm on the East Coast, and (re-)elected a president who is ready to take action on climate change. As Climate Central puts it, at his first press conference after the election
Obama reaffirmed his view that manmade emissions of greenhouse gases are contributing to global warming, and stated his intent to continue to take action to reduce greenhouse gas emissions. “I am a firm believer that climate change is real, that it is impacted by human behavior and carbon emissions,” he said, noting that, “we have an obligation to future generations to do something about it.”
Here's a short piece from Auden Schendler about how we can go about it. He outlines three approaches - the Charge of the Light Brigade, the Battle of Leye Gulf, and the Battle of Agincourt. Schendler's providing an interesting metaphor. I think his deeper point is well taken - feel free to discuss in the comments.

Image via telegraph.co.uk

Wednesday

Another caution in chart interpretation

From the Atlantic's Derek Thompson, a graph showing youth unemployment in Europe, with particularly high numbers in Greece and Spain. He's pulled numbers from a Eurostat report. Without knowing more, it's hard to tell whether he's cherry picked data or not. To his credit, he explains what, exactly, he's graphing:
Here's what the graph doesn't tell us: That a majority of Greek and Spanish young people don't have a job. Unemployment is a ratio: Unemployed people / the workforce. If you're in school or not actively looking for a job, you're not counted in the unemployment rate. As a result, the same number of unemployed young people will yield a higher rate with a smaller workforce. A different ratio calculated by the BBC with Eurostat figures -- unemployed youths as a percentage of the whole youth population -- yields a 19% figure for Spain and a 13% figure for Greece.
Here's what the graph does tell us: Young workers in Greece and Spain are facing an absolutely egregious work drought, where half of high-school and college-graduates ready to find a job aren't finding one.
But when you look at the full report, you can see he's omitted the countries with lower rates of youth unemployment. You can infer that they must be there, since the EU average is so much lower than the rates for Greece and Spain. It would have been nice to see them (they are: Germany, 8.1%, the Netherlands, 9.4%, and Austria, 9.7%.) There's also no source listed for the US data. So the bottom line is, be cautious.

Tuesday

The Trust for America's Health has published a new report called "F as in Fat: How Obesity Threatens America's Future 2012." Brian Fung of the Atlantic writes that according to the report, at present rates, at least half of Americans in 39 states will be obese. The map above? That's a projection, based on present rates, showing which states will have an obese population of 50% or morein 2030. Because trends might change, here's a somewhat less depressing map showing 2011 obesity rates (from the Trust for America's Health):


The Trust for America's Health has an interactive map that allows you to compare obesity rates in 2030 if BMI is reduced 5%, and obesity rates in 2030 if there's no change. And you can get the full report here.

What's the consequence? The Trust for America's Health states that if we can succeed in reducing adult obesity, we will lower disease rates and health care costs:
If BMIs were lowered, the number of Americans who could be spared from developing major obesity-related diseases could range from:
  • Type 2 diabetes: 14,389 in Alaska to 796,430 in California;
  • Coronary heart disease and stroke: 11,889 in Alaska to 656,970 in California;
  • Hypertension: 10,826 in Alaska to 698,431 in California;
  • Arthritis: 6,858 in Wyoming to 387,850 in California; and
  • Obesity-related cancer: 809 in Alaska to 52,769 in California.
And nearly every state could save between 6.5 percent and 7.9 percent in health care costs. This could equate to savings ranging from $81.7 billion in California to $1.1 billion in Wyoming. Florida, the only state that would save less than 6.5 percent in health care costs, could save 2.1 percent or $34 billion.
It's, well, food for thought.

Friday

A video clip for the long weekend

Did you play imaginary games with yourself, staring out the car window? I do, too. And here's a video suggesting that, well, we all do it.

Jack Kerouac probably wasn't the first, either. What does this have to do with my numbers blog? Well, we all think we're unique. It's one of the arguments I get when I work with staff in programs that are starting to use outcome measures (and sometimes when they've been using them for a while): we're all different. Lumping us all together to count things overlooks our differences. Well, yes. But we have some commonalities too, and it's occasionally helpful to be reminded of that. The Atlantic posted a brief interview with the creator, Ian Bennett, here. Enjoy the long weekend!

Tuesday

Olympics Roundup

The pending London Olympics bring to mind all sorts of numerical constructs, including this article by Nate Silver of the New York Times (taking a break from political commentary for the Olympics? Here's James Fallows' thought about the American practice of stopping our campaigns in the summer.) Silver is writing about which sports (weightlifting, but not badminton) smaller nations should pick in order to put their athletes in medal contention. There was also an interesting article in yesterday's NY Times about nations, or sporting federations, using various undercover tactics to understand competitors', well, tactics.* And here's an article from The Atlantic.com about why hosting the Olympics is usually a bad economic bet.

So it seems like a good time for an update on the 2012 Greatest Sporting Nation quest. As you may recall, I mentioned it in this post last year, comparing sports ranking methodology with the New York City Public Schools methods rating methodology for schools. (The school raters would learn something from the sports raters.) The screenshot above is Greatest Sports Nation's look at the "Global Cup Progress." GSN also predicts that the US will "win" the Olympics, with "win" defined as most placements in the top eight of every sport, weighted by popularity (number of countries that participate in each sport) and whether the sport is a team or an individual sport. Junkies can read the full methodology here.


_____
* Sorry if I'm putting you above your 10-article monthly limit if you're not a subscriber. The Atlantic Wire has a nice daily feature "Trimming the Times" that summarizes the 10 top stories every day.

Measuring disease

I realize you may not actually have asked for it, but the chart in the screenshot is one of my favorite charts ever, starting with the name. It illustrates the cover of the New York City Department of Health and Mental Health annual package of vital statistics, (2010 version available here). I like it for its clarity, the way it puts even the horror of 9/11 into perspective, and the short history of successful tackling of public health problems it offers.

I was reminded of it when I saw this broader take on theatlantic.com:
The bar chart comes from an interactive graphic from a New England Journal of Medicine article discussing the differences in disease between 1810, when the Journal published its first issue, and 2010. (Nephropathy, according to the Free Dictionary, is any disease of the kidney.) I found the discussion in the NEJM article about the social definitions of disease equally interesting.
Disease is always generated, experienced, defined, and ameliorated within a social world. Patients need notions of disease that explicate their suffering. Doctors need theories of etiology and pathophysiology that account for the burden of disease and inform therapeutic practice. Policymakers need realistic understandings of determinants of disease and medicine's impact in order to design systems that foster health. The history of disease offers crucial insights into the intersections of these interests and the ways they can inform medical practice and health policy.
And measurement, as always, is complex. The authors say:
Disease is always generated, experienced, defined, and ameliorated within a social world. Patients need notions of disease that explicate their suffering. Doctors need theories of etiology and pathophysiology that account for the burden of disease and inform therapeutic practice. Policymakers need realistic understandings of determinants of disease and medicine's impact in order to design systems that foster health. The history of disease offers crucial insights into the intersections of these interests and the ways they can inform medical practice and health policy.

Friday

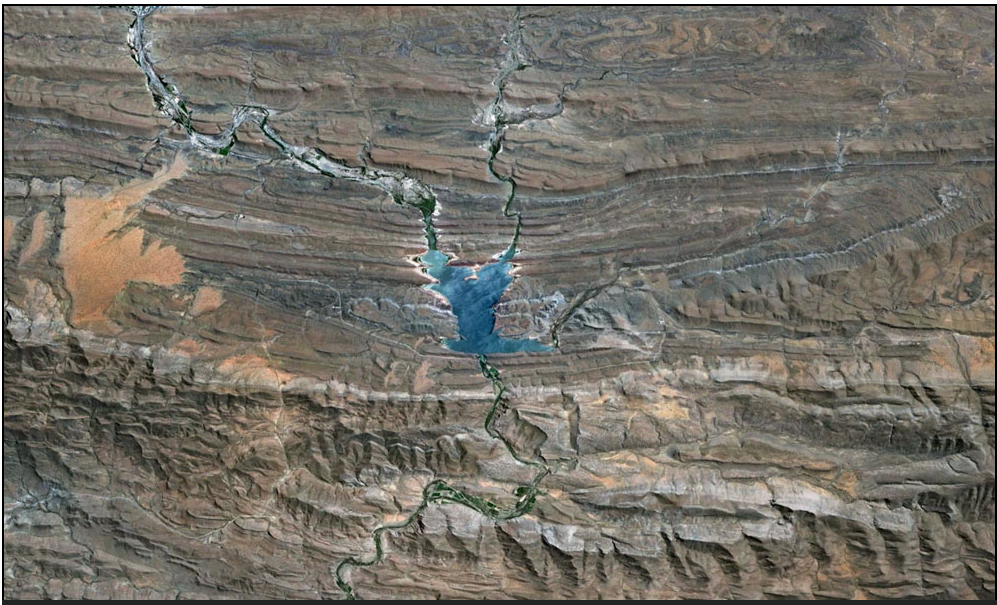
The Atlantic's Google Earth Puzzles


The Atlantic has set some entertaining geographical puzzles, using images from Google Earth. They're challenging, but the last two are multiple choice, so you have a one in three chance of getting it right even if you guess.

So far there have been three:

The first is here.

The second is here.

And the third is here.

The screenshot is one of the images - many of them are beautiful, and all are interesting. Take a guess before you look at the possible answers to get a look at the availability heuristic in action.

Popular Posts