Wednesday

It's an election year! Time to start obsessing about polling

Let's start with Presidential approval ratings.

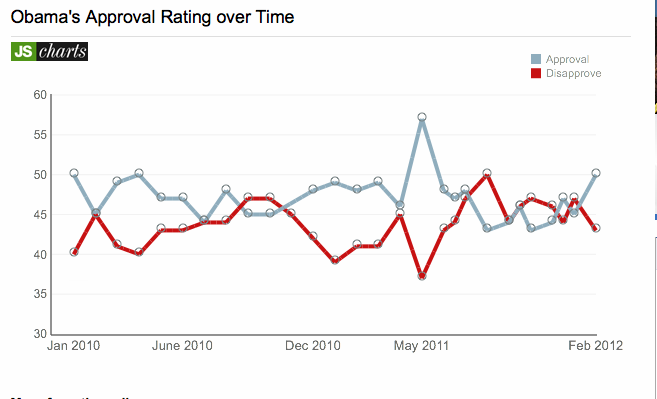
According to a CBS News poll released yesterday, President Obama's are up, reaching 50% for the first time since May, 2011:


CNN's polls say the same thing. So do Rasmussen Reports, which says that 49% approve of the President, and that 49% disapprove. They display the data differently:

What's going on here? I suspect it's in the way the questions are asked and the data tabulated. If CBS and CNN subtracted the lukewarm approvals from the strong approvals, you might get the 27% strong approvals that Rasmussen reports. But it appears that right now there are more people expressing strong and lukewarm approval than there are expressing disapproval. The takeaway? If you can, look at more than source for information. And think about how each organization is reporting its data. And right now, in a head-to-head competition, even Rasmussen reports that Obama beats Santorum and Romney.

Which is what Nate Silver, of FiveThirtyEight (now a part of the New York Times) reports as well. I should say that's what Silver concludes, as he is using an early stage model taking account of the economy, each candidate's ideology, and the approval ratings. He also has some projections about upcoming Republican primaries (in Arizona, Michigan, Georgia, and Ohio). FiveThirtyEight is a great site, and I'll be keeping an eye on it in the coming months. Even though the election is still nine months away.

Monday

Safety net issues

Update February 17: Here's a link to Paul Krugman's column on this article, titled "Moochers Against Welfare." It's worth reading all the way through to his apt conclusion.

In case you missed it yesterday, or read it before you had your coffee, take a look at this NY Times article about the increasing reliance on government programs around the United States. The reporters took a hard look at entitlement programs and who uses them. The tables are pretty good, and the interactive charts are even better, allowing readers to click on any county in the US and to see transferred income per capita, the share the transfer income is of all income in the county, and a comparison to the US average. The takeaway is that everyone uses government entitlements, including those who object to them.

Here's a screenshot of the map, showing Sumter County, Alabama, which I chose randomly:


The maps also break out different entitlements programs, including Social Security, Medicaid, Medicare, Income Support, Veterans Benefits, and Unemployment Insurance. (It would have been helpful if the Times had included numbers of people receiving benefits, but they didn't.) And the article includes a nice statement by a political scientist about how the states that receive more benefits than they pay in taxes tend to vote Republican, while states that pay out more than they receive tend to vote Democratic.

There's an argument being made that the inclusion of veterans benefits is a mistake, as they are earned by service to the country, and in any case drive up payment of government benefits in the south. I disagree with the first point (and let me be clear, I am not arguing against payment of benefits to veterans, I just see no reason not to include them in this analysis). As for the second, according to the Times, veterans benefits account for only 0.4% of personal income in 2009, compared to 17.6% for all government benefits. That's too small to drive any of these numbers.  There has been a series of articles recently about the transformation of the VA medical system into a model of good care. Here's one from a couple of years ago.

Friday

Education inequality

Today's NY Times carries a story about several studies, collected by the Russell Sage Foundation into a book, about the rising inequality in education based on income. It's interesting, and that's because the recent studies show that family income, not race, is the biggest dividing factor in achievement. The first chapter is available online, as are the tables. They're worth looking at (and much better than the partial table published in the Times). Here's a screenshot of one table, illustrating enrichment expenditures on children by income quintile:

Source: Russell Sage Foundation

Take a look at the tables, and the first chapter. I found them pretty depressing. But if you draw another conclusion from them, let me know by commenting.

Wednesday

Open data, gathered at one site

The US Government's open data site, data.gov, subject of an earlier post, now links to open data sites from foreign countries, states, and local governments. Even though the data provided by different governments are a mixed bag, it's a very useful site. Colorado, for example, has a beautiful photograph illustrating its site, and provides a collection that includes Colorado hospitals, private schools in Colorado, and the Colorado lottery numbers.

New York State's link take you to the State Senate data set, which might be fun to explore - one dataset that I downloaded is the NY Senate web analytics, which lists the number of Facebook fans each Senator (with a Facebook presence) has. New York City provides nearly 1000 datasets, including the average SAT scores of 2010 high school seniors in the city's public schools. Indiana's link - yes, I tried it - doesn't load properly.

Of the international datasets, Australia's is pretty great. It includes a link to apps that developers have created from the data. The screenshot at the top? That's a pretty important one.

Tuesday

Ross Douthat and Abortion

Ross Douthat had a column in Saturday's New York Times called "The Media's Blinders on Abortion," arguing (1) that the media generally ignore the fact that the United States is becoming more anti-abortion, and (2) that Planned Parenthood's downplays abortions as a percentage of its services.

A lot of people commented on various aspects of the piece, including the fact that Douthat has never had to decide to terminate a pregnancy. Several also stated, correctly, that Planned Parenthood provides health care for many low-income women across the country. I want to comment on Douthat's use of statistics, because I think he's cherry-picking.

First, here's what he says about American attitudes:
In the most recent Gallup poll on abortion, as many Americans described themselves as pro-life as called themselves pro-choice. A combined 58 percent of Americans stated that abortion should either be “illegal in all circumstances” or “legal in only a few circumstances.” These results do not vary appreciably by gender: in the first Gallup poll to show a slight pro-life majority, conducted in May 2009, half of American women described themselves as pro-life.
Yes, Gallup reports that in May 2009, slightly more Americans reached in its "Values and Beliefs" survey called themselves "pro-life" rather than "pro-choice" (51% to 42%). But the report goes on to say that, as has been true for many years, most (53%) of Americans felt that abortion should be legal under certain circumstances. (There is a lot of variation among which circumstances.) But that was two years ago. The most recent (2011) poll still shows that most Americans believe abortion should be legal under some circumstances. The percent of Americans saying abortion should be illegal under all circumstances has ranged, since 1975, from a low of 13% to a high of 23%. In 2009 it was, guess what, 23%. By 2011 it had dropped back to 20%. These are probably normal fluctuations due to polling issues, and Douthat should have reported them. (I use "Americans" in this paragraph, as Gallup does on its website, but the correct term is probably "respondents.")

Here's what Douthat says about Planned Parenthood's services:

It’s true that abortion is only one of the services Planned Parenthood provides. . . But abortion is hardly an itty-bitty and purely tangential aspect of its mission, as many credulous journalists have implied.
Planned Parenthood likes to claim that abortion accounts for just 3 percent of its services, for instance, and this statistic has been endlessly recycled in the press. But the percentage of the group’s clients who received an abortion is probably closer to 1 in 10, and Planned Parenthood’s critics have estimated, plausibly, that between 30 and 40 percent of its health center revenue is from abortion.
By way of comparison, the organization also refers pregnant women for adoption. In 2010, this happened 841 times, against 329,445 abortions.
Planned Parenthood, the parent organization, provides aggregated, summary information about services provides from its affiliates throughout the country. (The affiliates decide which services to provide. Some provide abortions, but others don't.) That aggregated information is the source of Douthat's claim. The 2010 summary available as a pdf here, but I'll post a screenshot:
It appears that Douthat's claim that abortion might be as much as 10% of services is based on comparing the 330,000 abortions to the 11,000,000 different services Planned Parenthood provided. Did he do the math wrong? In any case, it's an apples-to-oranges comparison: some patients may have received more than one of the services.

But it's more important, once again, to consider the context. The Alan Guttmacher Institute reports that the number of abortions per 1000 women aged 15-44 has been declining; in 2008, the latest year for which figures are available, that was 19.6 per 1000, down from a high of 29.3 per 1000 in 1981. In 2008, 1.21 million abortions were performed in the United States. The average cost per non-hospital abortion under local anesthesia (ie, most abortions)? Under $500. Remember, also, that 87% of US counties, where 35% of US women reside, did not have an abortion provider. That means that those sites that perform abortions, Planned Parenthood among them, perform more than their share of abortions.

I could go on. (Like Douthat's suggestion that it's somehow weird that Planned Parenthood refers women for mammograms? So does my Park Avenue ob-gyn. It's not like getting a dental x-ray). But if someone is going to take on an organization like Planned Parenthood over statistics, they need to do it right.

Thursday

College applications in the US - Early Admissions

This is the second in a series of posts about the college admissions process in the US. You can read the first post in the series, a general discussion of the landscape, here. Today I am going to talk about early admissions policies at selective colleges.

There are basically three kinds of early admissions programs. Under binding early decision (ED) programs, the student commits to withdrawing all other applications and attending a college if admitted. Under early admissions (EA) programs, students signal a keen interest in a college but do not have to commit to attend the college if admitted. Under rolling admissions programs, colleges start admitting students early in the year, then keep admitting students until a class is filled. Rolling admissions programs are non-binding. Large state universities often use rolling admissions programs.

If college admissions are a geologically active landscape, Early Decision is one of its volcanoes. Parents and students have learned that applying early under a binding ED program can increase the chances of admission, and academic studies bear this insight out. But students who are admitted to more than one college, in the spring, can pick among (or negotiate) financial aid awards, an option that is foreclosed under binding ED programs. Since students applying to early may get a significant admissions advantage,* that's a significant trade-off. 

Thus whether to apply early, and where, are two important decisions applicants make early in the fall of senior year. But it's not a simple decision. The book “The Early Admissions Game: Joining the Elite” (2003) by Avery, Fairbanks, and Zeckhauser makes clear that despite the admissions advantage, simply applying early does not necessarily increase a student’s chances of acceptance. The authors advise: look for a good match and understand that their key insight is that “applicants stand to gain most from applying early when they have moderate chances of admission in the regular process.” If a student has only a poor chance of admission in the regular process, then applying early will not help; if the student has a good chance of getting in during the regular process, then he or she will probably be admitted later in the spring. 

So the application has to be to the right school that is a good match for the student. And on top of all the other challenges, extremely selective colleges keep changing the game. Yale and the University of Chicago have non-binding Early Action programs. In 2006, Harvard and Princeton ended their early decision programs. In 2011, they reinstated them, as non-binding Early Action programs.

What is happening this year? The New York Times reports an increase in the number of early applications in the fall of 2011; Bloomberg News reports a decrease in the overall number of applications. It appears that Harvard and Princeton’s reinstatement of Early Action programs may have resulted in fewer applications to other Ivy League schools. On the other hand, because of its reinstated program and its outreach efforts, Harvard reported greater diversity in its early action applications in the fall of 2011 than it had seen in the past:
Compared with the Class of 2011, when 4,010 applied early, African-Americans now comprise 9.1 percent of the pool, a 61 percent increase; Latinos comprise 9.1 percent, a 31 percent increase; Native Americans make up 1.1 percent, a 29 percent increase; and financial aid applicants are nearly 72 percent of the pool, a 9.4 percent increase.   
It may be that two new trends are becoming evident: more students may be applying early, and they may not be applying to as many colleges overall. That number is still to come.  (Unfortunately I cannot seem to format this footnote properly.)*About that advantage. Avery, Fairbanks, and  Zeckhauser put it this way in “The Early Admissions Game”:
Applying early provides a significant admissions advantage, approximately equivalent to the effect of a jump of 100 points in SAT-1 score. Applying early to an ED school provides a slightly larger advantage than applying early to an EA college.  . . . Moreover, we find that the claim made by some colleges that the pool of early applicants is much stronger than the pool of regular applicants is part exaggeration and part myth. Early applicants have slightly higher test scores and high school class ranks than regular applicants at the most selective EA colleges, but early applicants tend to be slightly weaker in these qualifications than regular applicants to ED colleges.

Wednesday

College rankings scandal

There have been several articles this week reporting an admissions dean's efforts to inflate the SAT scores of incoming students, apparently in order to influence the US News and World Report rankings.
The main details: the school is Claremont McKenna College in California; the collective scores were apparently inflated by 10-20 points, and the admissions dean has admitted his actions and resigned.

Here is a roundup of some of the articles from the NY Times, the LA Times, and Bloomberg.

I know that lots of questions remain, but in my view, the real scandal is the too great weight given to those rankings, and I intend to make them the subject of one of my posts in the series about college admissions (yes, I'm really working on it). Here's a link to a great article in the Washington Monthly about the pernicious effect of the rankings. It was published nearly 12 years ago, and what has changed? Very little (though the USN&WR does disclose more of the methodology of its ranking system). Click here for the Washington Monthly's "different kind of" college ranking.

Oh, and if you really want to know what's going with a college? If your child is applying, visit! Talk to students and faculty, and let your child spend the night in a dorm. And take a look at the college's common data set, usually available on the website. Here's a link to Claremont McKenna's.

Popular Posts